Dashboard
When you open Fleetroom, you’ll see different widgets on the main page with basic information about your fleet.
When you open Fleetroom, you’ll see different widgets on the main page with basic information about your fleet.
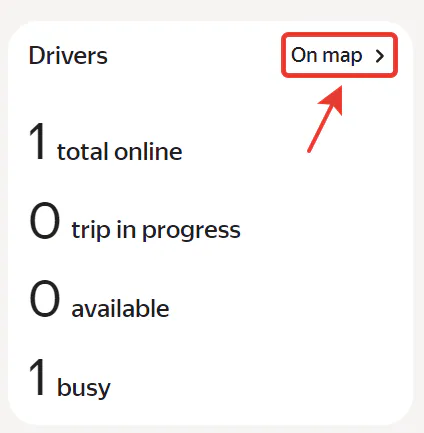
Most importantly, you can always see how many drivers and couriers are online/on an active trip/idle with the Busy status.
In the upper left corner, next to the fleet name, is the clid (your fleet's unique number).
On the same page you can find your dbid, which is the unique number of your Fleetroom consisting of several characters. To find it, open the address bar of your browser in the Summary section and look for the characters after "park_id=".


Section functions
1. Compare dynamics
On the Activity, Business Hours, Fleet Earnings and Trip Amount widgets, you can compare the current period (colored line) with the previous period (gray line).
For example, if you're looking at data for the Week, the colored line shows data from 7 days ago, and the gray line shows data from the previous 7 days. Red means negative dynamics, yellow means no change (the difference between periods is less than 1%), and green means positive dynamics.
2. Reports for each indicator
Check out the widgets in the upper right corner for links to reports and other pages with detailed information. For example, if you click Report in the Business Hours widget, the Summary Report opens, and in the Drivers section you can open an interactive map with drivers and their statuses.
3. Filters
Some sections have filters. You can click on them to view the dynamics for specific indicators. Filters contain the name of the indicator, its value and percentage changes.
For example, on the Fleet Earnings widget, you can use the filter to see revenue dynamics from just trips without taking bonuses into account.
To view the report for a certain period, select Day, Week, Month or specific dates in the filters.
Drivers
Here you can see the current status of drivers in real time: online, trip in progress, available and busy. When you open the map from the widget, you can see the driver's location and other trip details.
Activity
Activity shows the number of unique drivers and couriers with trips in the Completed status for the selected period.
This widget helps you calculate the days and times when drivers and couriers are most active and compare them with when people request trips most in order to encourage drivers to be online at the best times.

Hours online
This widget helps track the dynamics of when drivers and couriers have the Available status and On Active Trip status so you can help them if necessary.

Fleet earnings
Shows the types of fleet fees charged to drivers when completing trips with the platform. Shown in the local currency. The dynamics of the current period can be compared to the previous period.

Trip total
This widget allows you to find the time when the amount earned from trips is at its maximum, compare today’s figures with yesterday’s, and track the dynamics of trip earnings for the week without wasting time creating reports in other sections.
Only trips successfully completed by drivers and couriers are counted. Trips canceled by the driver, courier or passenger aren’t taken into account here. The amount earned from trips is displayed before the Yango fee.

Trips
Shows the number of trips grouped by status. You can open the report to filter trips and see all the details.

Service classes
Shows trip dynamics and the number of trips in each service class.

Payment method
Shows payment methods, their dynamics and quantity.
